
Leverage and Influence in a Nutshell
Once upon a data, there were outliers and influential observations in regression models. Using these models, we learnt that a common practice was to perform diagnostics checks to dig deeper and see how different points affect the fitted model or its coeffecients. So here we go!
In this post, we will focus on two concepts (leverage and influence), but we will not dig deep into the math behind them. We will try to visualize and catch the intuition behind them first. We will also use a simple Shiny App to demonstrate the concept. And if you get the idea with a simple linear regression model, it will be easy to extend it to more complex ones.
Leverage Definition
Leverage is a measure of how far an observation on the predictor variable (Let it be X) from the mean of the predictor variable. To understand it, let’s imagine a beam pivoted at a fixed hinge. The higher the leverage value of an observation, the more potential it has to impact the fitted model. This depends on how it conforms to the fitted model.
We can read this everywhere, but to get the concept easily, let’s look at the following example.
Intuition Behind Influential Observations
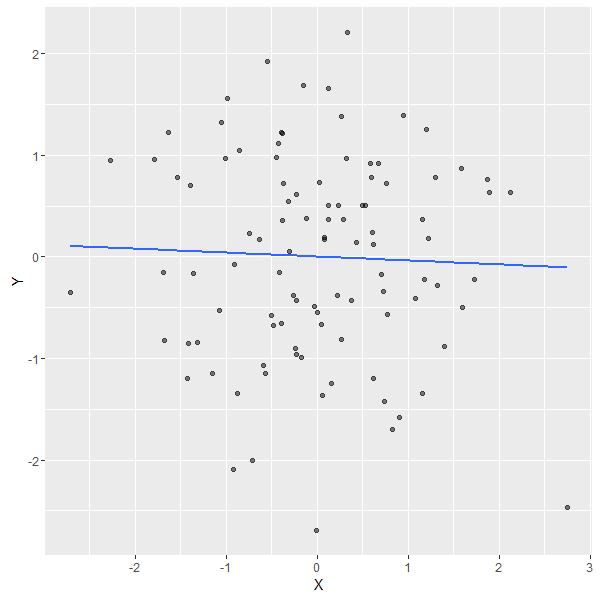
First , we will simulate 100 points and plot the regression line as follows:
set.seed(1523);

n <- 100;

X <- rnorm(n); X<-X-mean(X);
Y <- rnorm(n); Y<-Y-mean(Y)
Then we will zoom out and imagine a guy trying to pull the regression line, using a rope towards him. If he moves in different locations, where will he have high potential for influence with the ablility to exert it? and where will he have high leverage but little effect on the fitted model?
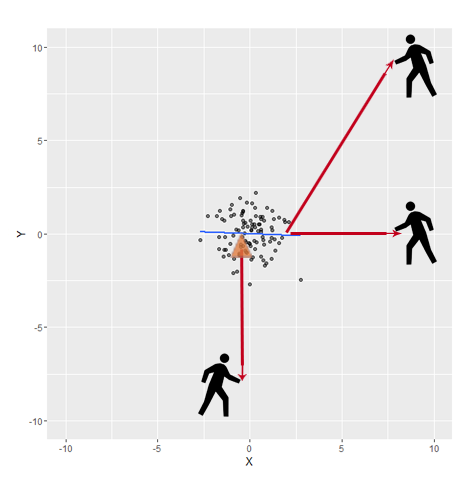
If you think of the regression line as a rod pivoted at the orange triangle, which is placed at the mean (here [0,0] since X,Y are centered), you will be able to conclude the answers easily. For example:
-
At [10,0], the guy has high leverage since he stands far from the cloud of the X values. And although he has the potential of high influence, he will not be able to impact the regression line significantly because his force is exerted almost parallel to the line.
-
At [10,10], he has both high leverage and high influence, since he stands far from the rest of the observations in X and Y. So he will affect the intercept and the slope of the regression line significantly.
-
At [0,-10], he will not have noticeable effect on the fitted line. Since he pulls the line towards him at the pivot, the exerted force is almost perpendicular to the line, and consequently will have no influence.
What if the guy moves to another location?. Now, it should be easy for you to expect whether he will be influential or not, following the same way of thinking. If you still need more examples, you can try the following Shiny app to adjust different values and check the outcome.
Shiny App
This simple Shiny App demonstrates the concepts of leverage and influence, displays the linear model coefficients and some of the influence measures for a point with adjustable coordinates. This point is prepended to the 100 points generated earlier. Then you can see how the regression line is affected and how the displayed values change.
Influence Measure
Now we got the intuitive explanation of the leverage and influence, but for multivariable regression or more complex models it is not easy to compare the model to mechanical system. That is why we use influence measures that can be calculated in R easily. The following are the measures we are interested in here. However, there are more values that are used in diagnostic analysis.
-
hatvalues : indicates the potential for leverage.
-
dfbetas : measures how much individual coefficients change when the ith value is deleted. We have dfbtea for each coefficient, so for example, in our linear regression model we have one for the intercept and one for the slope.
These values, and the rest of the influence measures, can be plotted versus the indecies of the observations to spot any extreme values and see the variations.
Now you can play more with the Shiny App to make sure your understanding of the displayed values goes with the intuition behind them.
(If you face any difficulty viewing the Shiny App, you can find it in a Github repo here)